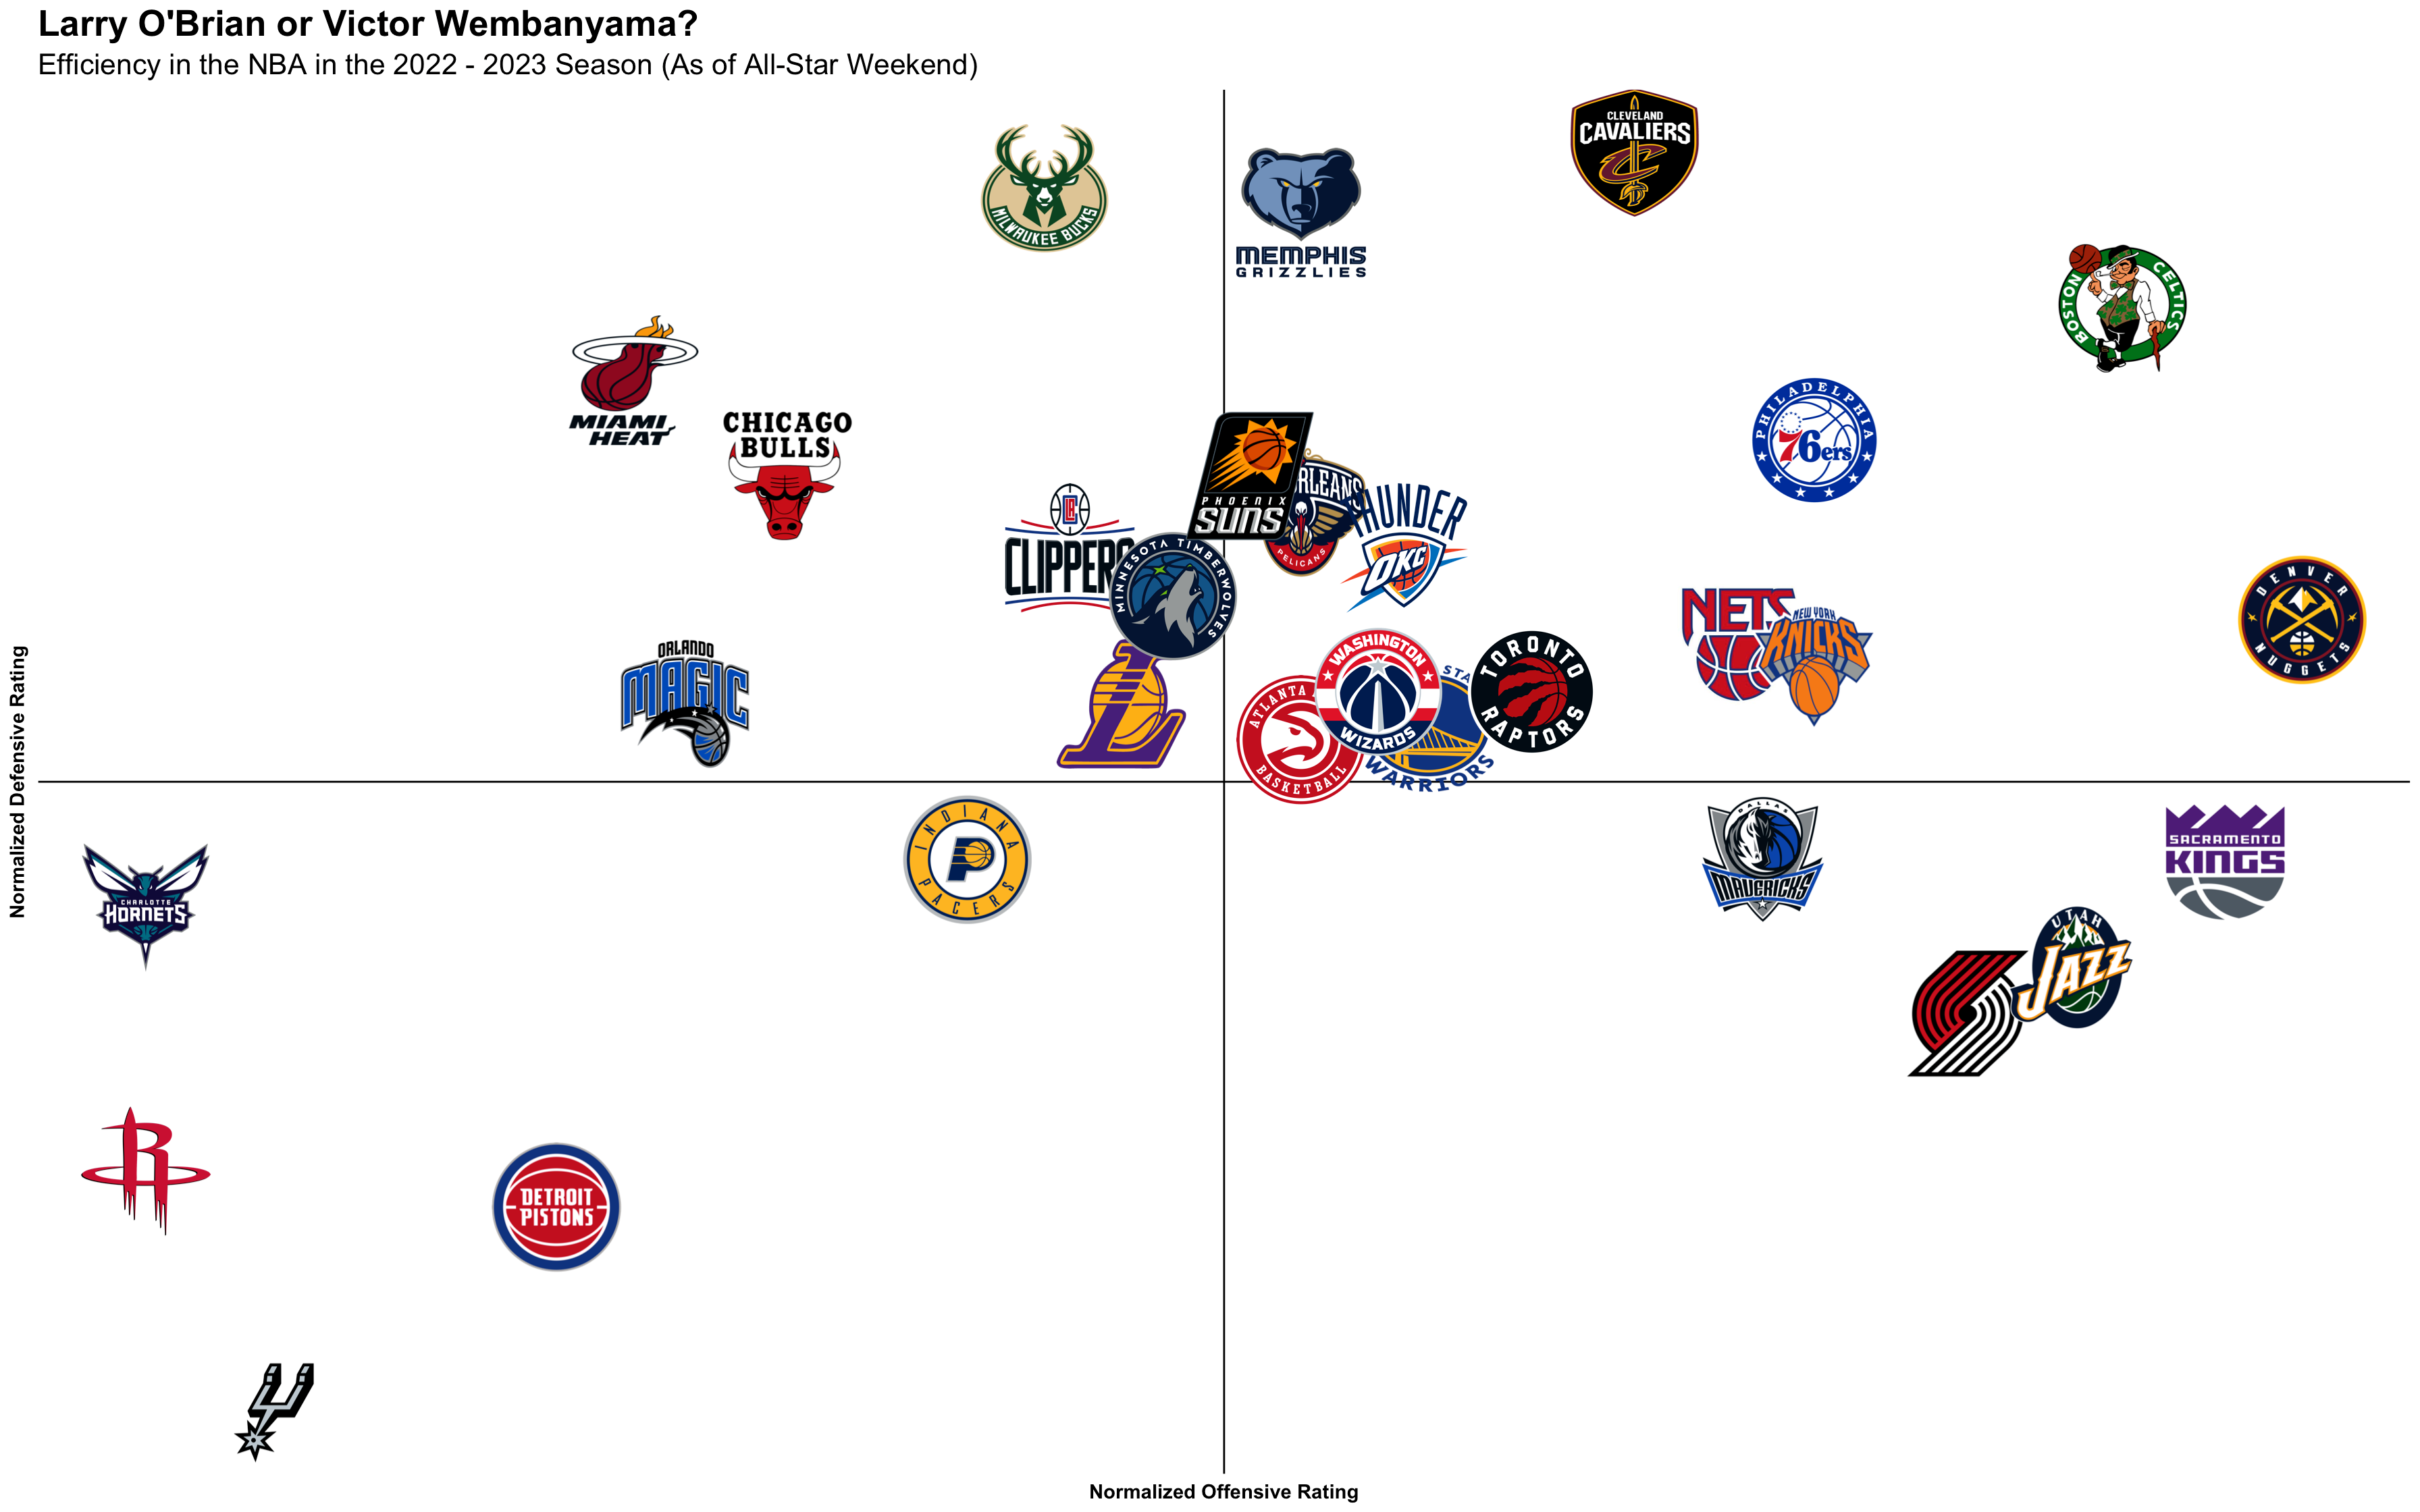
Using the NBA's statics for offensive and defensive efficiency, I plotted each team based their offensive and defensive efficiency ratings. I normalized each team's offensive and defensive efficiency from -10 to 10. I used -10 and 10 so I could have room to place the team logos as 1x1 square inch images. I used R and ggplot2 to plot the points for each team and then paste their team logo over their point.
The GitHub repository can be found here.