Spotify Grid

Create a Grid of Your Top Albums From Spotify With Python

Create a Grid of Your Top Albums From Spotify With Python

2023 Spotify Album Grid
2023

Updated: December 12, 2023 | Published: December 17, 2022


 Powered by AWS Polly | 0:00/0:00

Intro


I have always been interested in my music preferences and the raw data that is my streaming history. I recently built a custom Lifetime Spotify Wrapped and wanted to work on a visual project next. Spotify Grid.


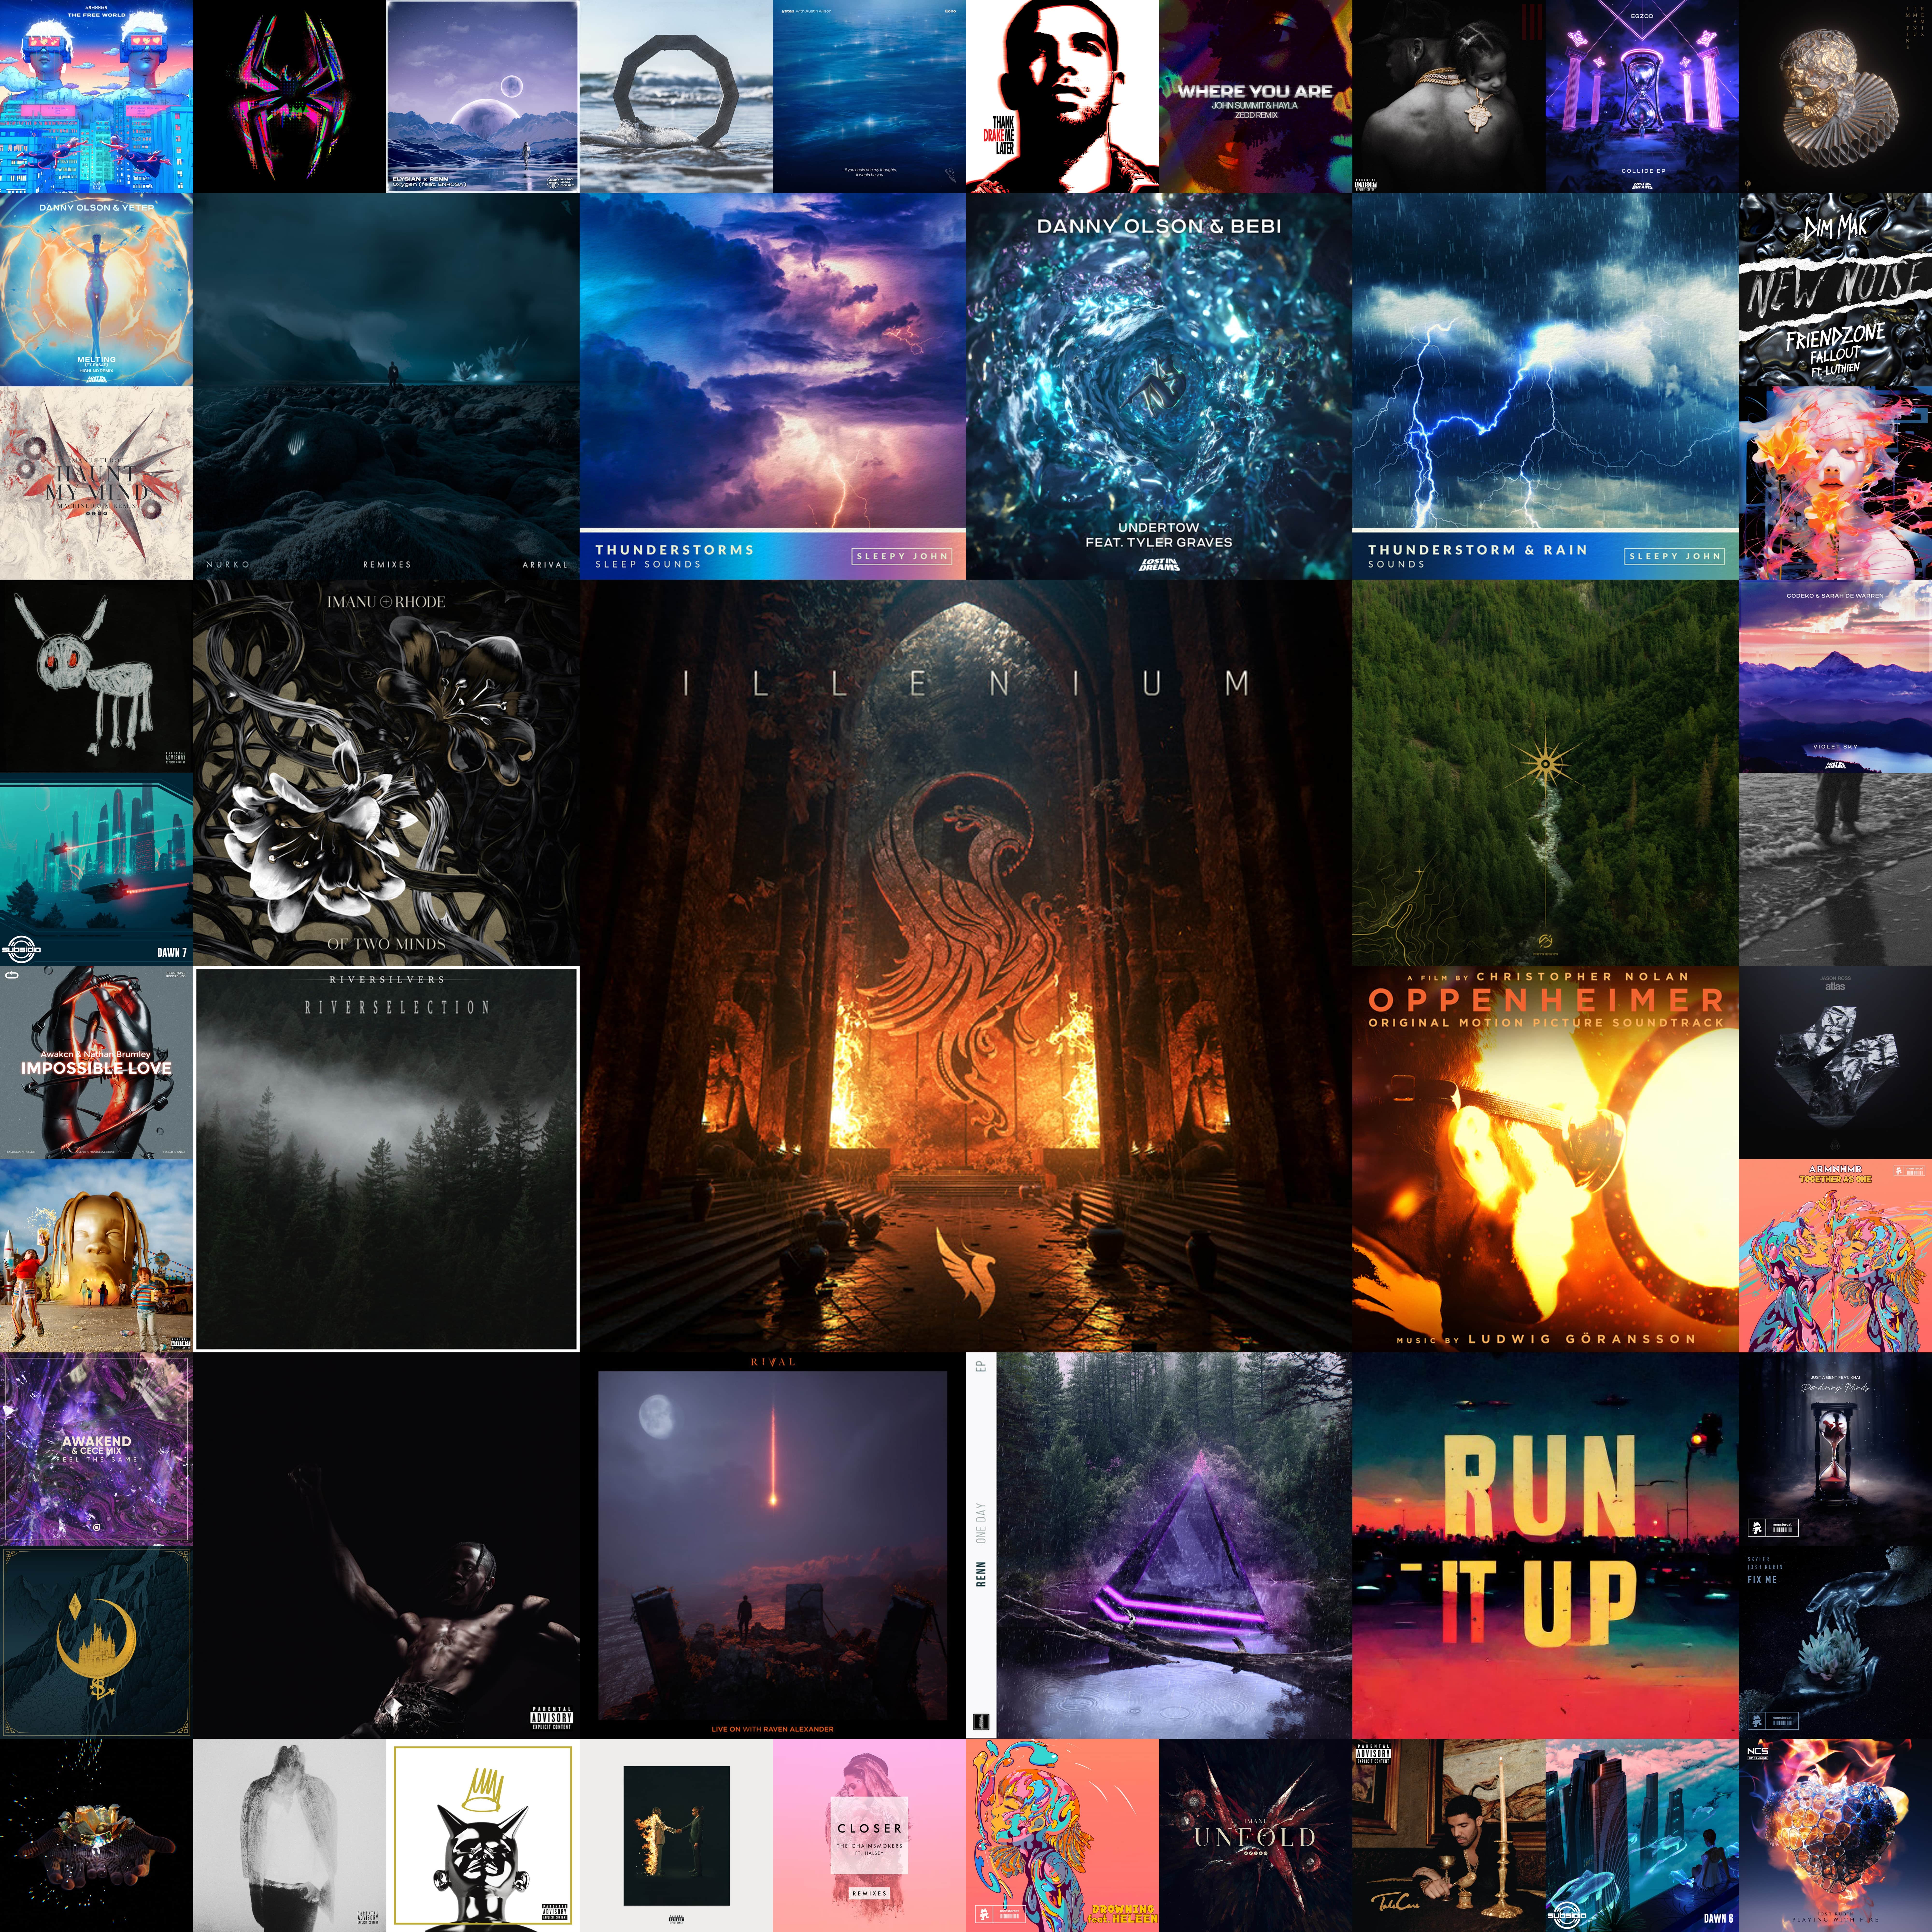
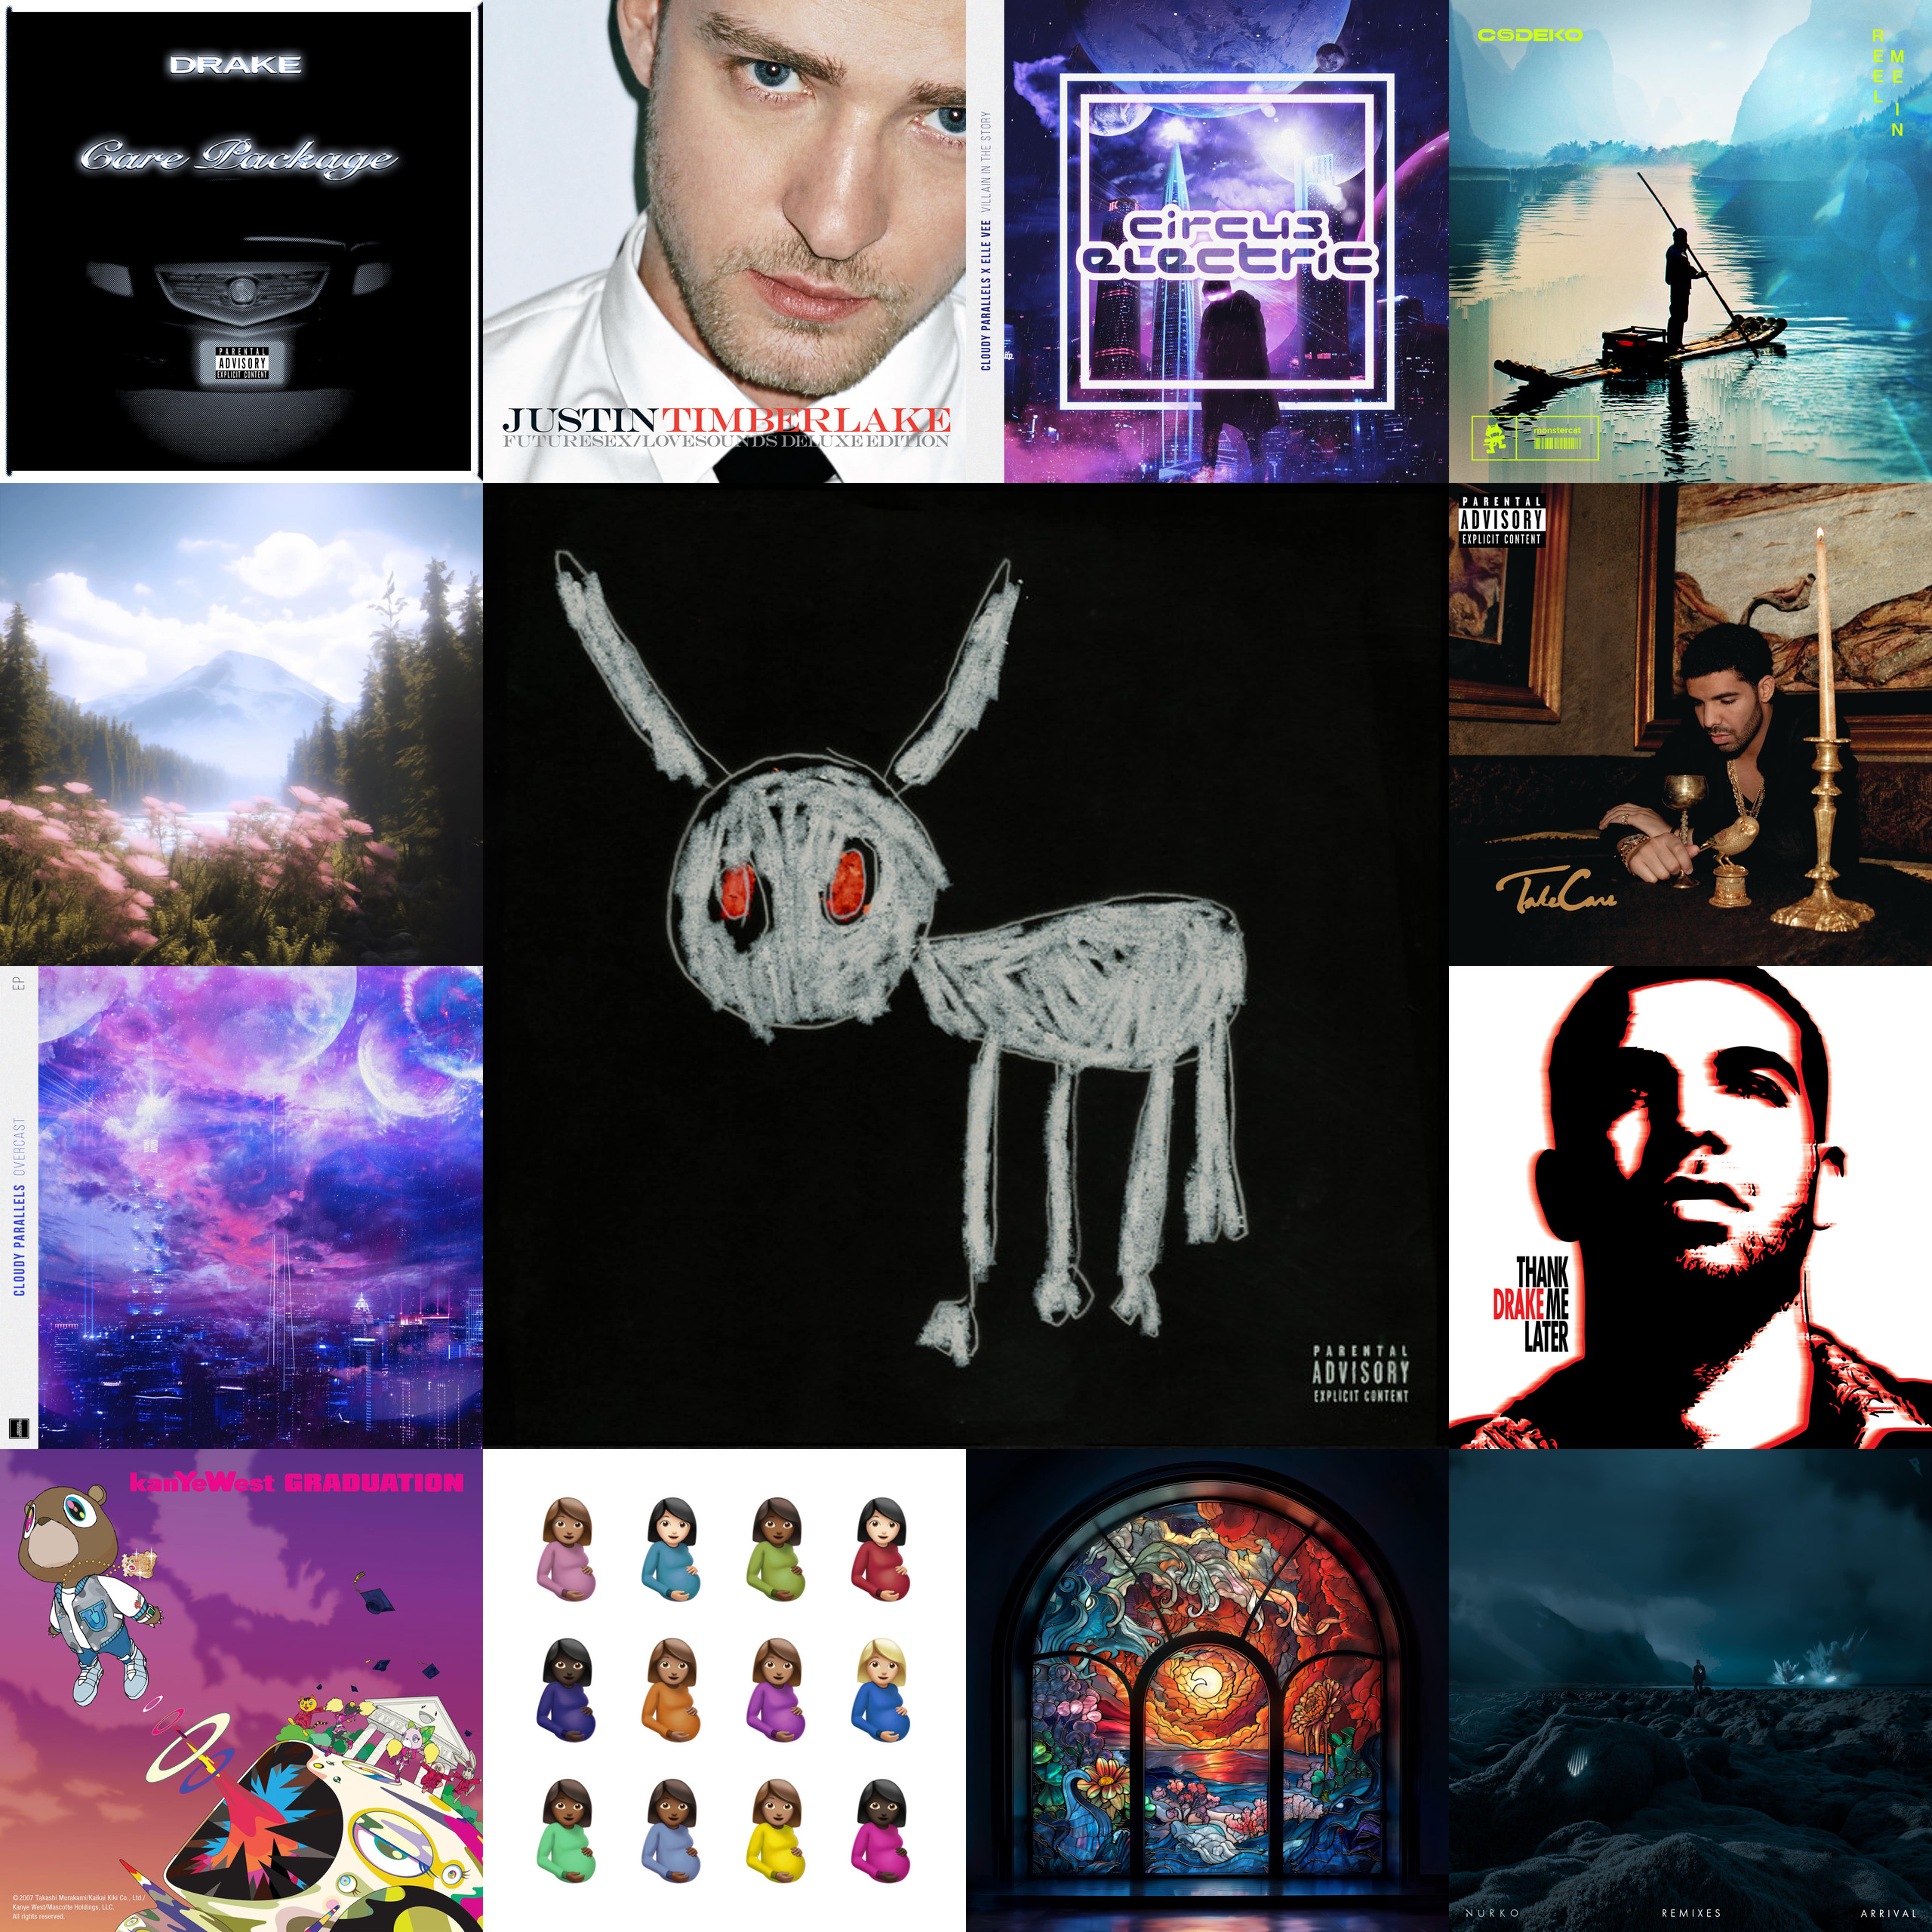
In this article, I will walk you through how to create a grid of your top-streamed album covers and artists from Spotify. The larger the image, the more times you’ve streamed that album or artist. The album in the center is my most streamed album. Starting from the top left corner of each ring and going clockwise, the albums/artists decrease in total streams.


To create your own Spotify Grid, you must have some files from another article of mine: Lifetime Spotify Wrapped. I did the majority of the work in that article and here I will walk you through how to put it all together using the Pillow library in Python.


If you just want to see how I did it, the entire code can be found here.


Once you have the necessary Excel files from your Lifetime Spotify Wrapped, you will need to import them into this Python script. Create two folders named 'Artist-Images' and 'Album-Images' in the same directory where you save this script.


Now that you have set everything up to download the images, you can do just that. Since you already have URLs for artist and album images, all you need to do is use Requests to download and save the image. This is where those folders from the last step come into play. This function takes in the path and type of grid with regard to the images to be downloaded. A list with your top 49 albums/artists is created as top_49 and is used to download each image from its respective URL.


After all the images are downloaded, you can make the grid! I created a function to do this work for me as the logic for an album vs. an artist grid is the same.


Here is the logic behind the function to create the grid. First, I created an Image object. This will be the background for the grid. I created an 8000x8000 pixel square Image object. Next, I need to paste the images on the Image object. I scaled the images based on the number of streams for that artist or album. The image in the center is my most streamed album/artist. There are two rings, each starting at the top left corner. The first ring has 12 images and the second ring has 36 images. The total number of images will be 49. That is why I only took 49 image URLs in the beginning. As for scaling, my top album was 3200x3200, the first ring 1600x1600 each, and the second ring 800x800 each. I opted for these dimensions because the images from the Spotify API are 640x640 and I did not want to scale any of them down so I could preserve their resolution.


Here is the logic behind the math for pasting the images. When pasting images at specific coordinate locations, the Pillow library pastes images at the top left corner of the provided coordinates. With the center image being 3200x3200, I pasted it at 2400, 2400 to center it at 4000, 4000. (3200÷2)+2400 = 4000. I did 3200÷2 because the center image is in the dead center of the plane, so 50% to the left, and 50% to the right. As for the rings, the x and y coordinates need to be shifted depending if the line is horizontal or vertical. For a horizontal line, the x-value must be shifted to move the images left and right. For a vertical line, the y-value must be shifted to move the images up and down. Since I used the value of the index of each image in the for loop to change the x and y coordinates, I had to set the starting coordinate farther and farther out as the image index I was working with increased. Finally, once all the images were set, I saved the grid as a PNG. Just beware, it will take about a minute to run as you are making a large object. In my case, the final image was 58 MB.


Now you can call the function twice and pass in the directory where the images are saved as well as the grid type to create your grids!


Final Thoughts


After completing my Lifetime Spotify Wrapped project, I wanted to display my results, just as many do with their Spotify Wrapped every year. That is when I thought about this project. These grids are a great addition for any music enthusiast to show off their taste in music.


Spotify Artist Grid