Intro
As a data and music enthusiast, seeing my Spotify Wrapped is one of my favorite moments of the year. The downside is it only arrives once annually and only tells the story of the past year. What if you could create a lifetime Wrapped from your full listening history—one that counts how many times you streamed a specific track, album, or artist?
In this article, I’ll walk through how to build your own lifetime Spotify Wrapped. You will:
- Download your extended Spotify data
- Transform your streaming history into a clean streaming log
- Use the Spotify API to add album and artist data
- Write an algorithm to compute your top artists, albums, and tracks
Once you complete these steps you can explore your lifetime Wrapped across several exported Excel files. Want to jump straight to the code? The script is on GitHub.
Download Your Spotify Data
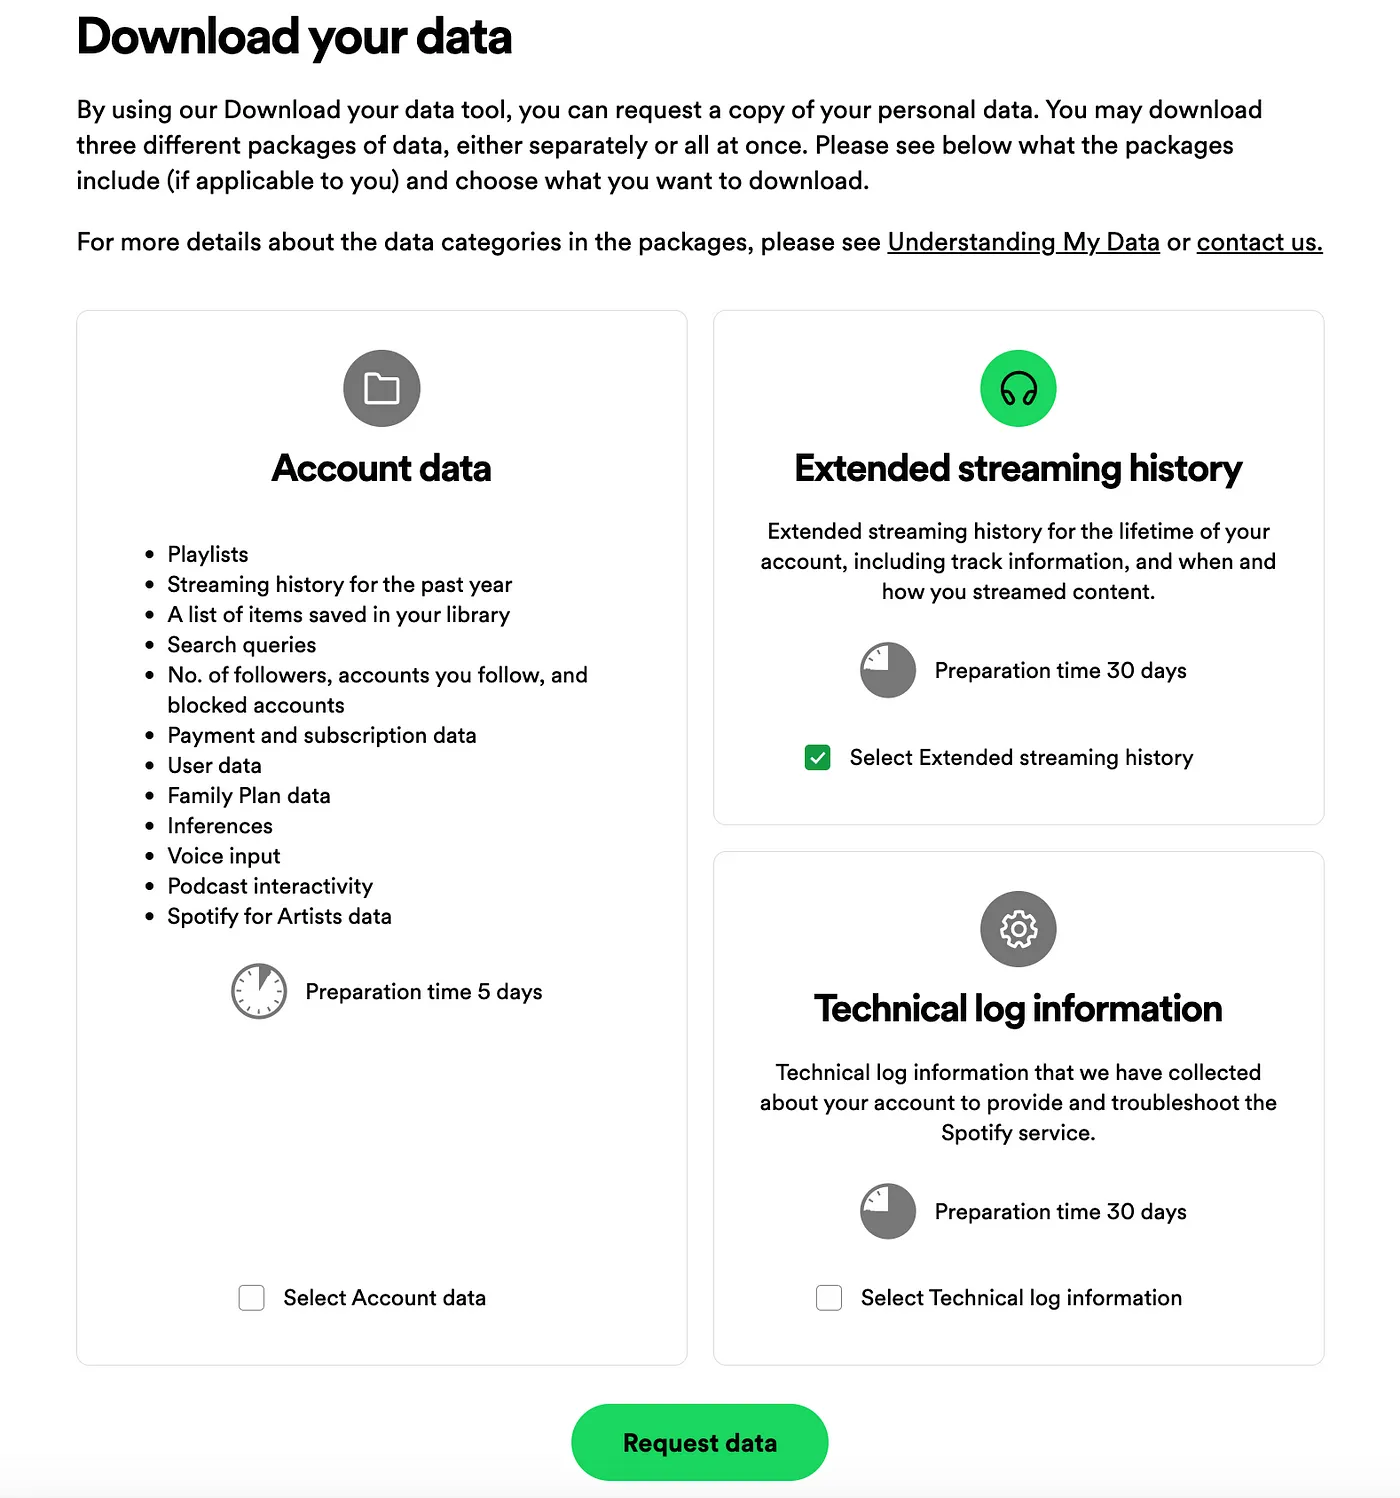
Downloading your Spotify data is straightforward but it can take time to receive it. Spotify states it can take up to 30 days; in my case it arrived in about two weeks.
Go to your Spotify Account Overview, then click Privacy Settings. Request Extended streaming history.
Creating a Spotify App
We’ll use the Spotify Web API to retrieve URIs for artists and albums. URIs (Uniform Resource Identifiers) uniquely identify tracks, albums, artists, playlists, and more. I count streams by URI to stay precise, and I also fetch artist and album images used later in my Spotify Grid project.
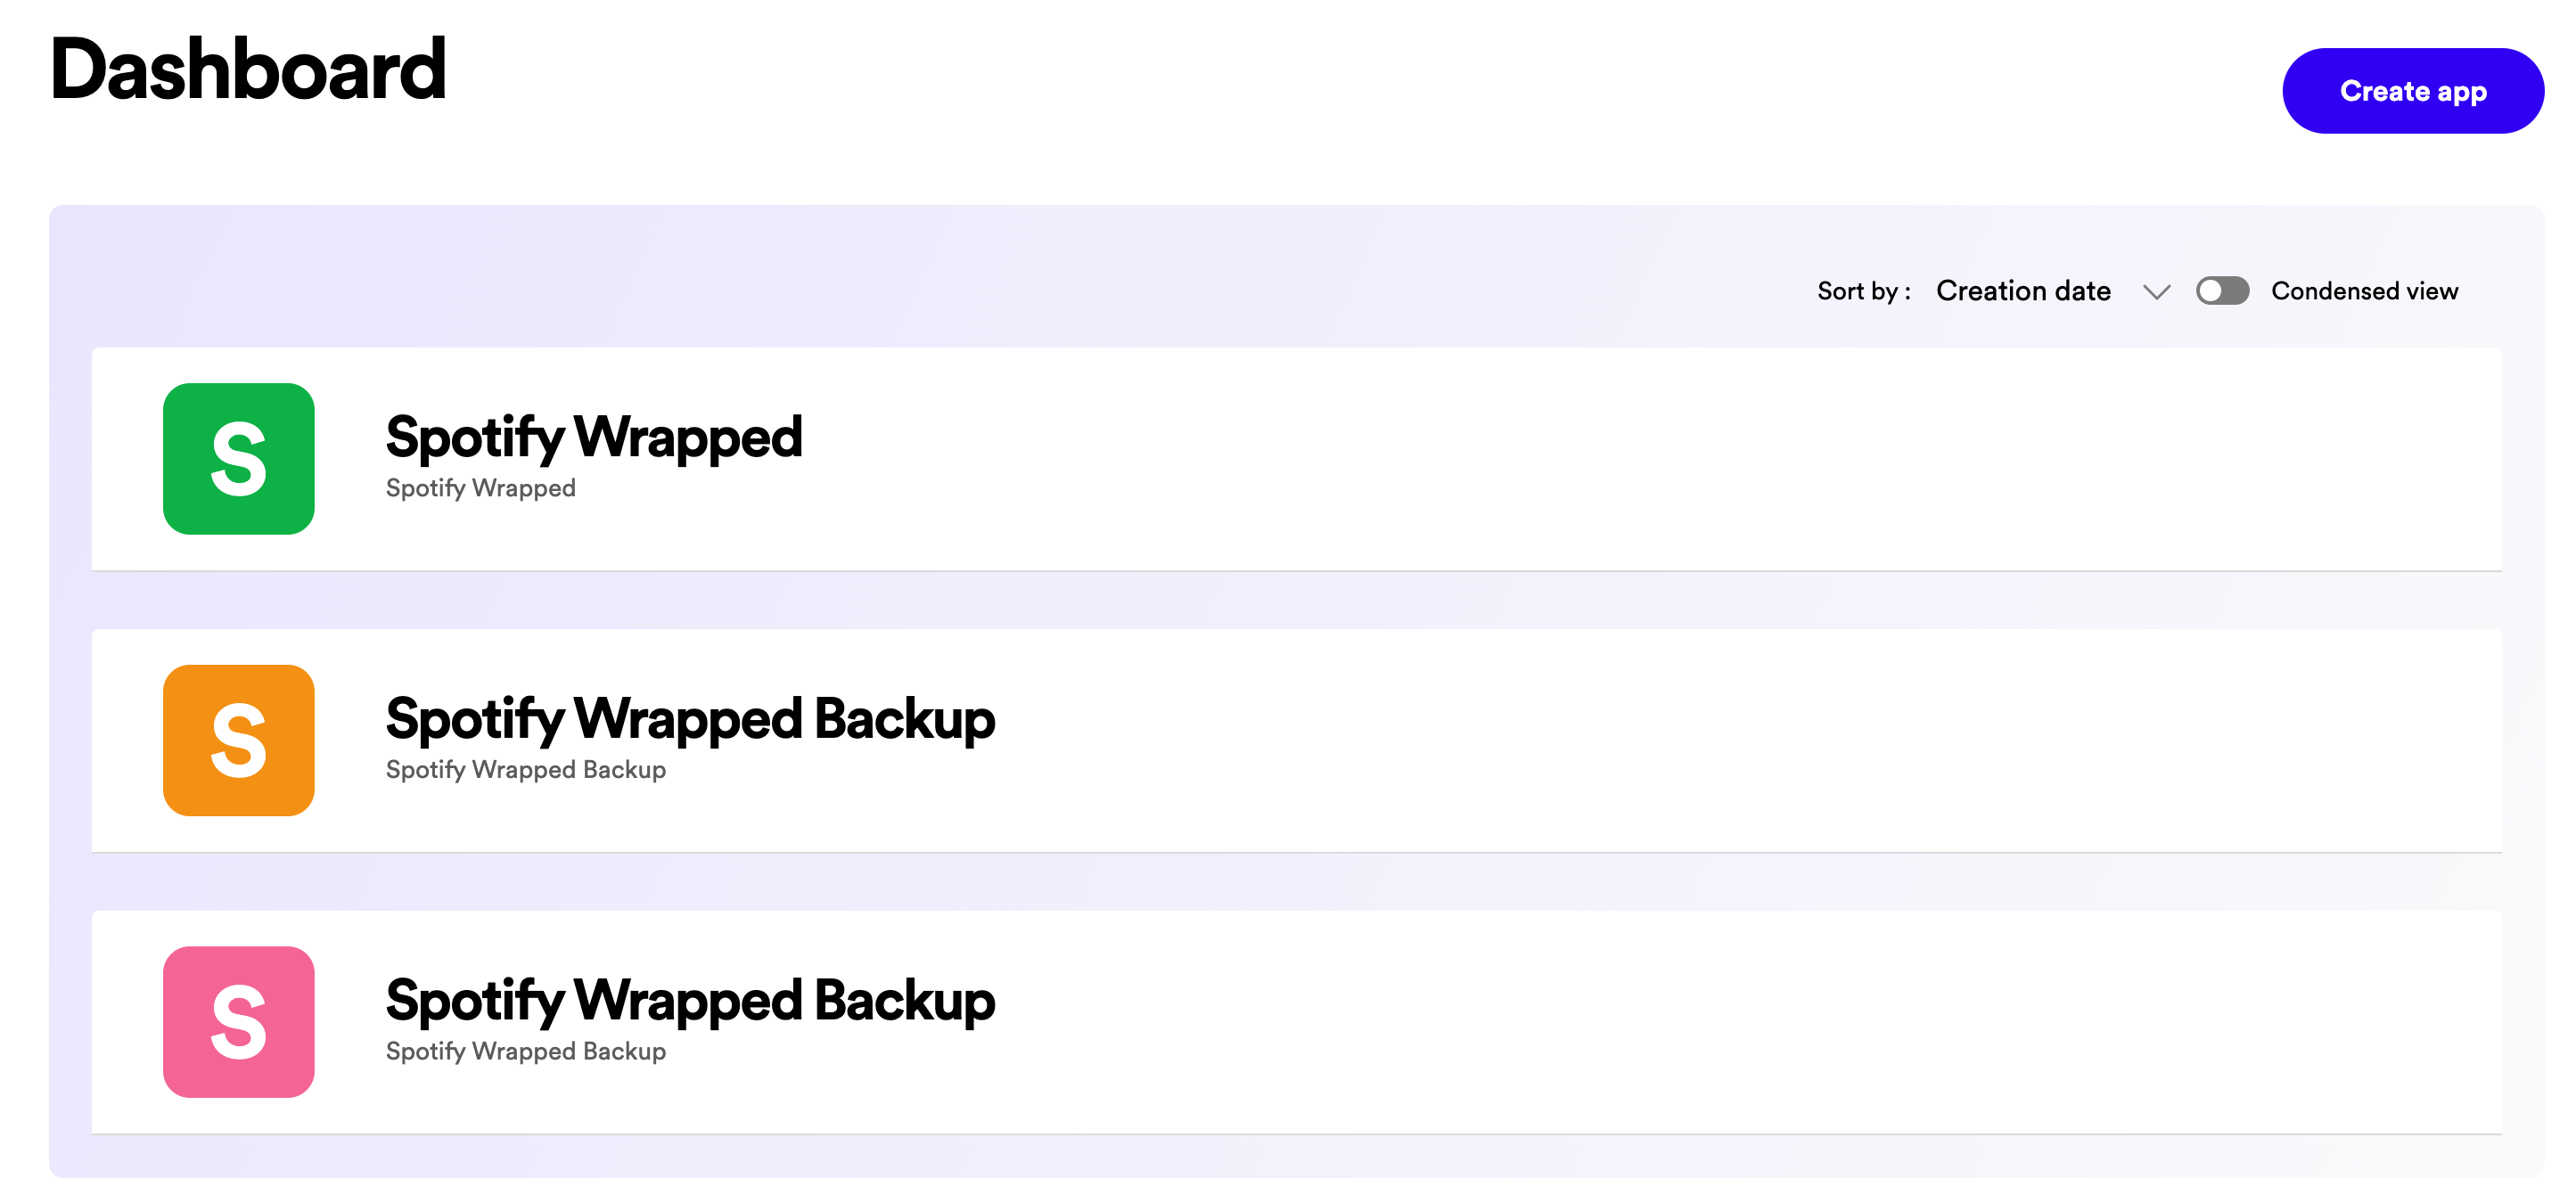
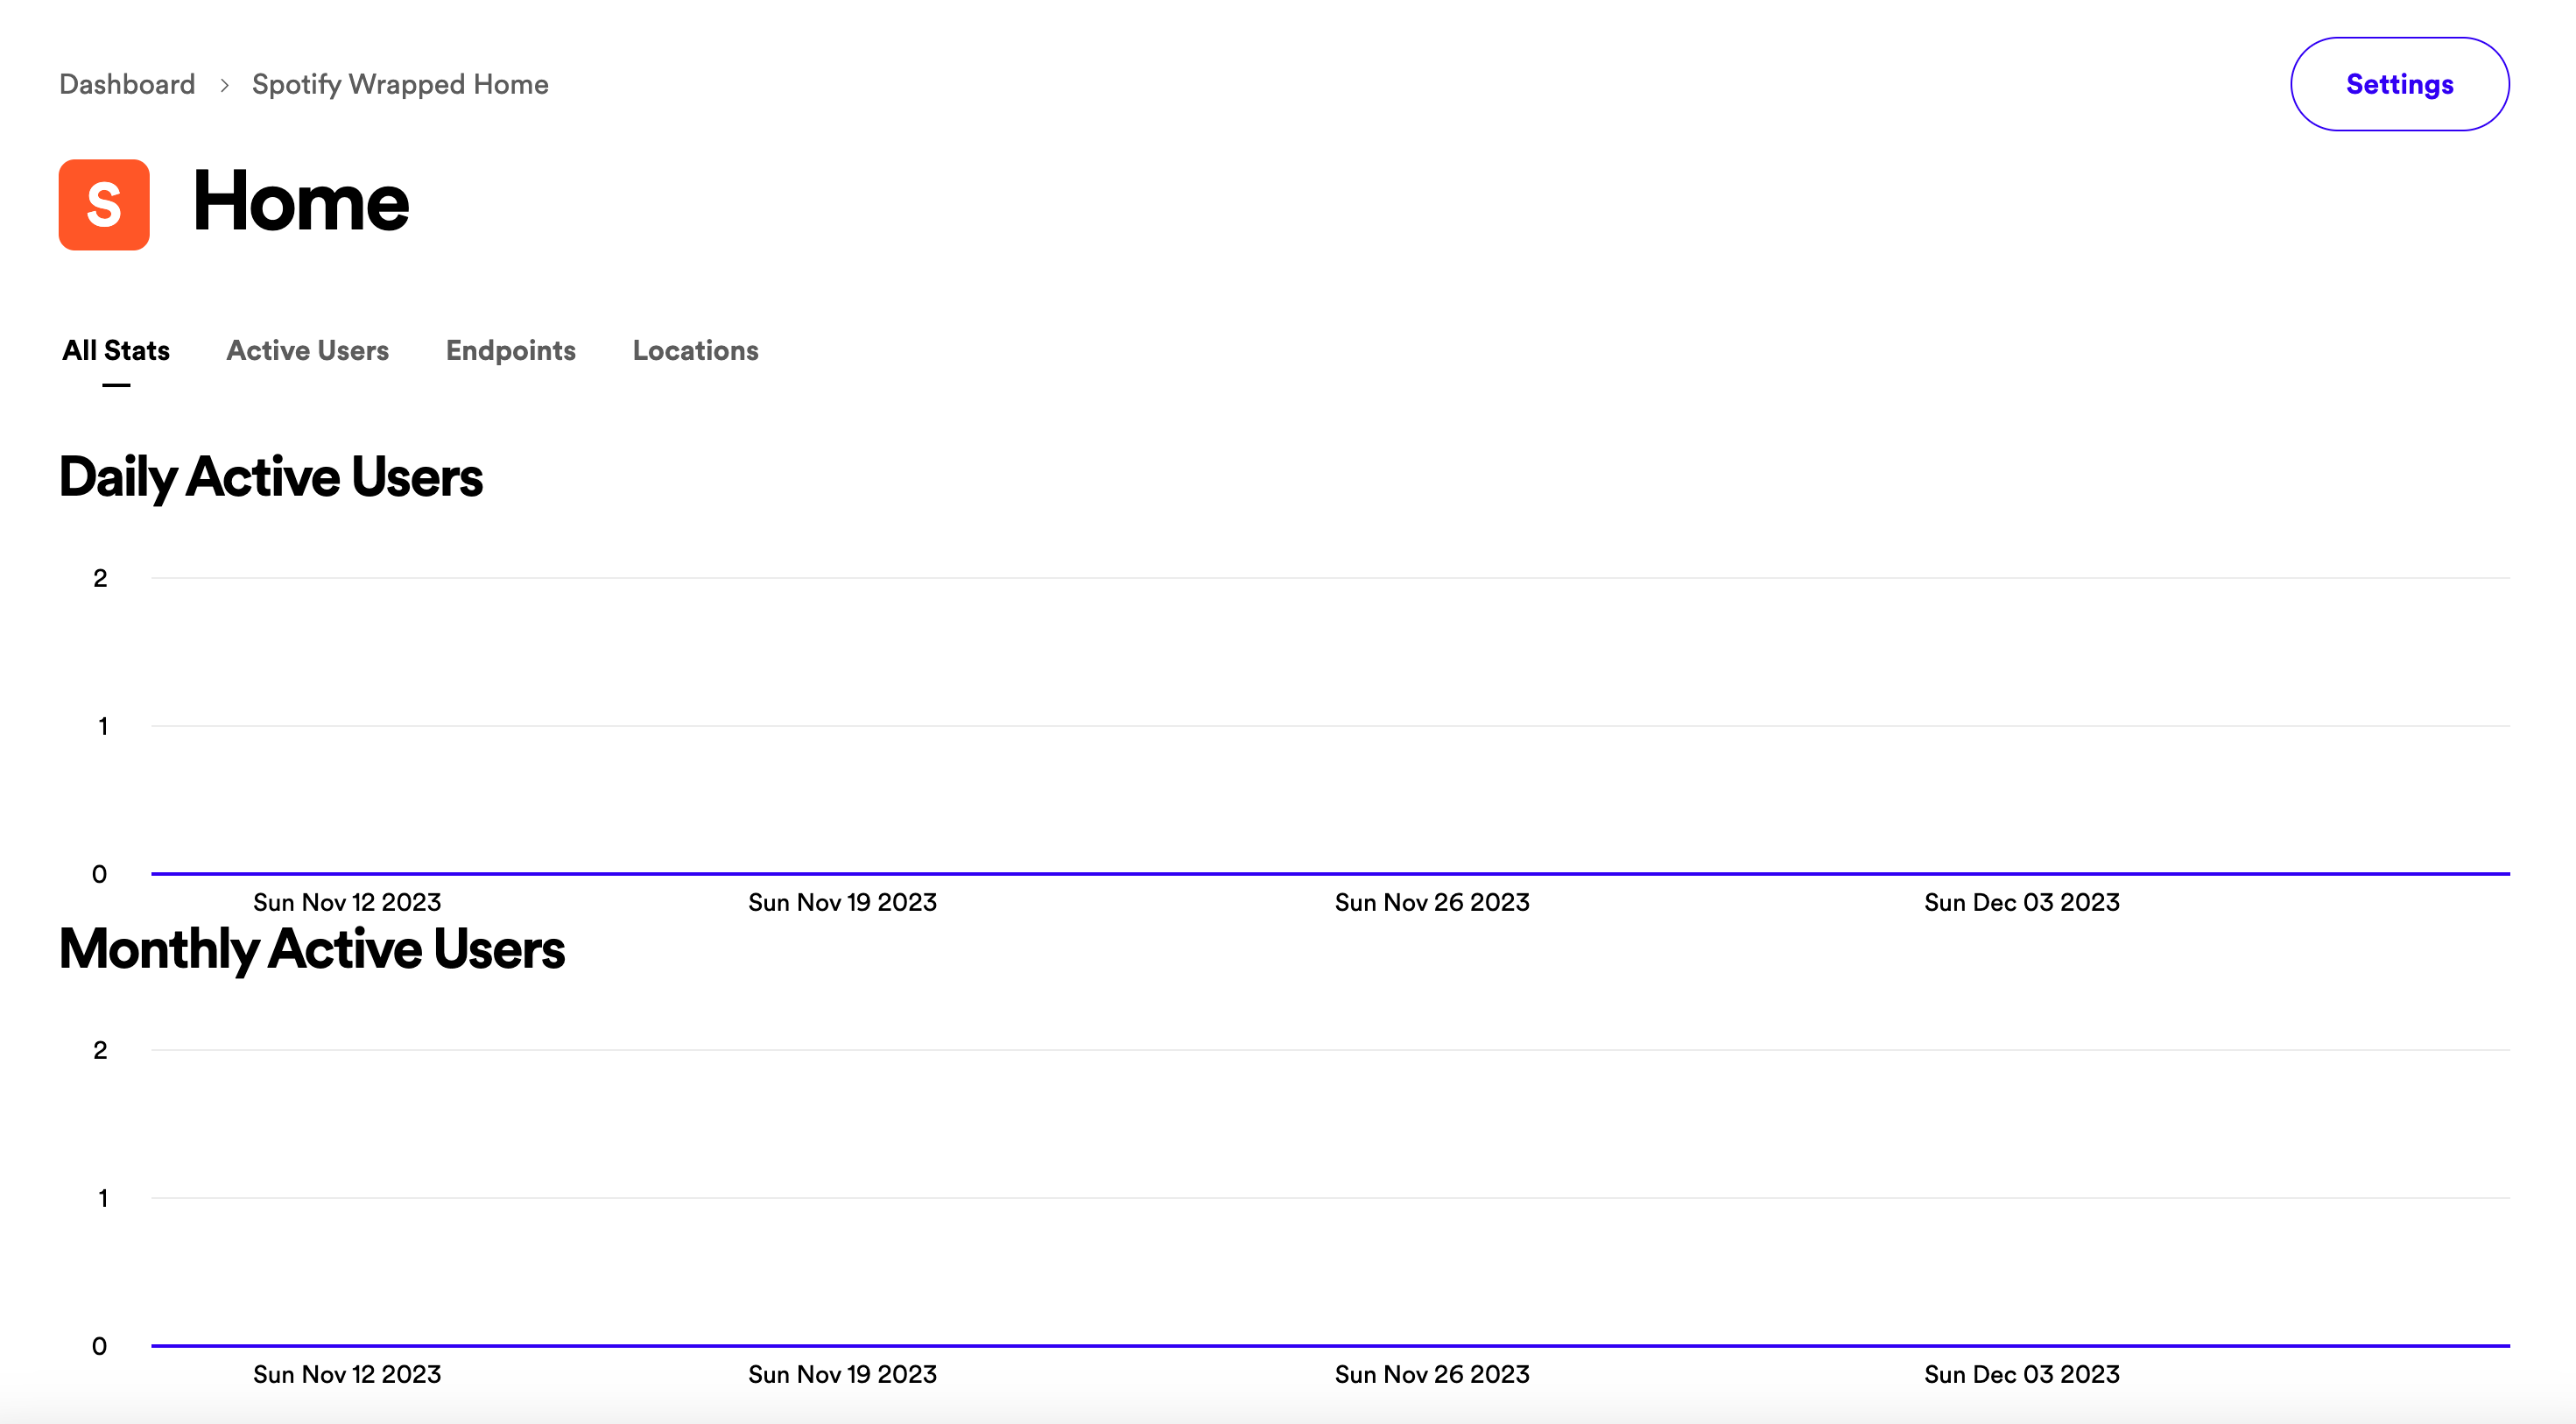
Create an app on the Spotify for Developers dashboard. Save the Client ID and Client Secret—you’ll use them to request access tokens.
Accessing the Spotify API
Use your Client ID and Client Secret to obtain an access token. Then you can call endpoints to fetch track, album, and artist data.
ETL
We’ll transform the raw JSON streaming history into a tidy DataFrame.
This concatenates all the Audio JSON files, filters out plays shorter than 30 seconds, and drops non-music items without URIs (e.g., podcasts).
Here we convert timestamps from UTC to your timezone (change US/Eastern if needed), optionally filter by date, export the streaming log to Excel, and compute total minutes streamed.
This loop finds the track URI with the most consecutive plays.
We assemble a clean DataFrame with track, album, artist, and track URI—dropping rows with missing values and normalizing URIs.
The Spotify API
To compute top artists accurately, count artist URIs rather than names (to avoid collisions). Start with the unique list of track URIs you streamed and request their corresponding artist and album URIs plus album cover URLs. Store these in a working DataFrame for merging later.
The tracks endpoint accepts up to 20 URIs per request, so batch into sublists of 20. Respect rate limits by sleeping before the 30-second window is exceeded.
Repeat for artists (this endpoint supports 50 URIs per call) to capture artist image URLs used in Spotify Grid.
Map image URLs and merge into the main streaming log by track URI.
Analyze Your Data
I compute top tracks, artists, and albums by counting URIs. One nuance: the same track can have multiple URIs (e.g., single vs album release). To handle that, group by normalized track name and map all URIs for that track to the most frequent URI before counting.
Now call get_top_100() to export your top tracks, artists, and albums.
Final Thoughts
I searched for a service that would report lifetime stream counts and couldn’t find one, so I built it. If you enjoy this, also try my companion Spotify Grid project, which generates a collage of your most-streamed albums and artists.